
Bring simplicity to your field service operations.
Our list of integrations is updated frequently. Explore each integration in its own separate page for more information.
Maintenance has shifted from reactive repair work to a discipline that directly influences profitability, asset lifespan, and operational stability. In modern field service environments, guessing is no longer tolerated. Decisions must be backed by data. Maintenance KPIs act as that foundation, turning scattered operational activity into measurable performance.
For teams starting out, the challenge is not a lack of data but a lack of structure. Without clear indicators, maintenance becomes a cycle of urgent fixes rather than controlled execution. This guide introduces the core metrics that allow organisations to move from firefighting to structured, proactive management, with a focus on practical application in European service operations.
Maintenance KPIs are quantifiable measures used to evaluate how effectively maintenance activities support uptime, reliability, and operational continuity. They translate day to day work into numbers that can be analysed, compared, and improved over time.
For a maintenance manager, these indicators are not abstract metrics. They directly influence staffing decisions, spare parts planning, and investment justification. Without them, it becomes difficult to explain why additional technicians are needed or why preventive maintenance budgets should increase.
Beginners often make the mistake of tracking too many indicators too early. Accuracy matters more than volume. A small set of reliable KPIs creates more value than a dashboard filled with inconsistent data.
Maintenance performance is best understood through a combination of leading and lagging indicators. Each serves a different purpose and relying on only one creates blind spots.
Lagging indicators reflect past performance. They show what has already happened, such as total downtime or the number of breakdowns. These metrics are useful for reporting and post analysis but do not prevent issues on their own.
Leading indicators, on the other hand, signal future performance. They include factors such as preventive maintenance completion rates or technician training levels. These indicators highlight whether the organisation is heading towards stability or disruption.
A balanced approach is essential. Lagging indicators explain the outcome, while leading indicators help influence it. Together, they provide a realistic view of operational health and allow teams to act before failures occur.
MTTR measures the average time required to diagnose and repair a failed asset. It reflects how quickly a maintenance team can respond and restore operations.
A high MTTR often points to deeper issues such as unclear documentation, lack of spare parts availability, or insufficient technician training. In many European service organisations, delays are also caused by travel time and fragmented communication between dispatch and field teams.
Reducing MTTR is not only about working faster. It is about removing friction from the repair process. Better job preparation, mobile access to service history, and clear task instructions all contribute to shorter repair cycles.
MTBF focuses on asset reliability. It measures the time between one failure and the next, providing a clear picture of how stable equipment is under current operating conditions.
A high MTBF indicates that assets are performing consistently and that maintenance strategies are effective. A low MTBF suggests that preventive maintenance schedules are either insufficient or poorly executed.
Tracking this metric helps organisations move beyond reactive thinking. It supports long term planning, including decisions on asset replacement, warranty negotiations, and lifecycle cost optimisation.
Planned Maintenance Percentage shows how much of maintenance work is scheduled in advance compared to reactive interventions. It is one of the clearest indicators of operational maturity.
Organisations that rely heavily on reactive work tend to experience higher costs, more downtime, and unpredictable workloads. Increasing the share of planned work stabilises operations and reduces emergency interventions.
For teams at an early stage, improving PMP is often the fastest way to gain control. Even small improvements in planning can significantly reduce stress on technicians and improve service quality.
Maintenance backlog represents the volume of approved but unfinished maintenance work. It is typically expressed in weeks and reflects how well resources are aligned with demand.
A small backlog can indicate underutilisation, while an excessive backlog signals bottlenecks and potential risk. When tasks accumulate faster than they are completed, critical issues may be delayed, leading to unexpected failures.
The goal is not to eliminate backlog but to maintain a controlled and predictable level. This ensures that technicians always have work ready without overwhelming the system.
OEE combines availability, performance, and quality into a single percentage that reflects overall production efficiency. It is widely regarded as a key metric at executive level.
While it may seem complex for beginners, understanding OEE provides valuable context. It shows how maintenance performance affects broader business outcomes, not just technical operations.
Improving OEE requires coordination between maintenance, production, and management. It highlights that maintenance is not an isolated function but a central contributor to operational success.
Collecting accurate maintenance data is often more difficult than defining the KPIs themselves. Manual reporting introduces delays, inconsistencies, and errors that quickly undermine confidence in the data.
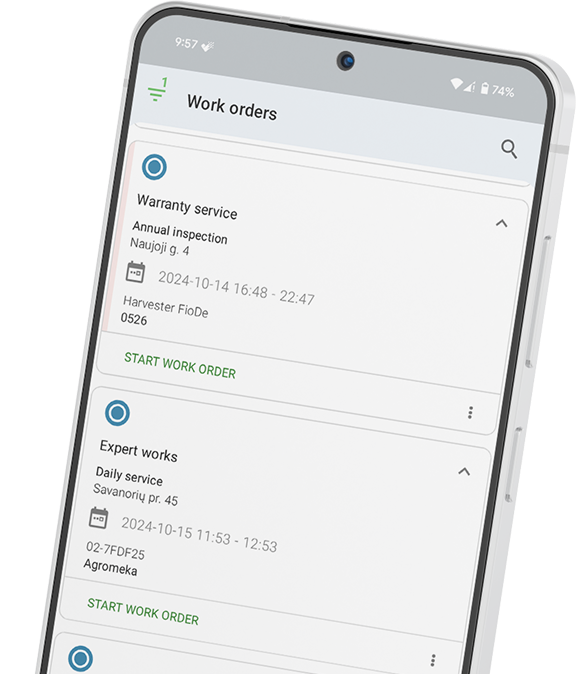
Frontu addresses this by capturing information directly from the field through its mobile application. Technicians record work in real time, eliminating the need for later data entry and reducing administrative workload.
This real time approach ensures that maintenance metrics are based on actual activity rather than reconstructed reports. Managers gain immediate visibility into performance, allowing them to respond quickly to emerging issues.
Frontu also consolidates this data into dynamic dashboards, transforming raw inputs into clear, actionable insights. Instead of spending time compiling reports, teams can focus on decision making and operational improvements.
For organisations transitioning from paper based processes, the shift is gradual but impactful. Integration can begin with a limited set of workflows and expand as confidence grows. The result is a structured, reliable foundation for KPI tracking without disrupting existing operations.
Adopting maintenance KPIs does not require a complete system overhaul from day one. The most effective approach is to start small and build consistency over time.
Tracking just a few indicators such as MTTR and planned maintenance percentage can already provide meaningful insights. As data quality improves, additional metrics can be introduced to deepen understanding.
The real value of KPIs lies not in the numbers themselves but in the decisions they enable. Better planning, faster response times, and improved asset reliability all stem from clear, consistent measurement.
For organisations looking to strengthen their operations, the next step is not collecting more data but collecting the right data in a structured way. Evaluating automated tracking solutions is often the turning point that transforms maintenance from a reactive cost centre into a controlled and measurable function.
A CMMS focuses on asset management, including lifecycle tracking and maintenance planning. Work order software is centred around task execution, helping teams assign, track, and complete jobs efficiently.
Yes, modern solutions such as Frontu support offline functionality. Data can be captured in the field and synchronised once connectivity is restored, ensuring uninterrupted operations.
By enabling immediate job completion reporting, organisations can invoice faster. This reduces delays between service delivery and payment collection.
The transition is manageable when supported properly. Solutions like Frontu provide structured onboarding and allow teams to adopt digital processes gradually.
Initial benefits such as improved visibility and reduced administrative effort are often immediate. Long term value comes from trend analysis and continuous optimisation.
The main challenges include ensuring consistent data entry and gaining team acceptance. Clear processes and proper training help overcome both.
Yes, platforms like Frontu offer integration capabilities that connect operational data with financial systems, creating a unified view of performance.


Our list of integrations is updated frequently. Explore each integration in its own separate page for more information.
Link copied!
Join 10,000+ FSM leaders. Subscribe to our monthly expert-led newsletter. We find and report on case studies, success stories and playbooks that are working out there right now.