
Bring simplicity to your field service operations.
Our list of integrations is updated frequently. Explore each integration in its own separate page for more information.
Field technicians work alone at customer sites. Managers rarely see how the work happens in real time.
That creates a hard problem. How do you measure technician performance fairly and accurately?
Many field service teams still rely on gut feel. Managers judge technicians through customer complaints, random feedback, or brief site visits. Those methods lack context and consistency.
Digital work orders solve that problem. Every completed work order stores evidence of how the job was done. It records time spent, parts used, customer sign-off, repeat visits, and job outcomes.
That data creates the most reliable basis for technician performance tracking. The challenge is not data collection anymore. The challenge is knowing which metrics matter and how to use them well.
Work order data gives managers an objective view of technician performance. It records what happened during the job instead of relying on opinion or memory.
That matters because subjective reviews often create bias. One manager may value speed. Another may focus on customer feedback. Work order data creates one shared standard.
It also creates consistency across the team. Every technician gets measured against the same metrics for every completed job.
Over time, work order history becomes a full performance record. Managers can spot trends instead of reacting to isolated events.
Patterns become easier to see. One technician may excel with electrical repairs but struggle with HVAC diagnostics. Another may work fast but generate more repeat visits.
That level of insight rarely appears through manual observation alone.
First-time fix rate measures how often a technician resolves a job on the first visit. No return visit or escalation should happen within 30 days.
This is one of the strongest field technician KPIs available. It reflects diagnostic skill, preparation quality, and parts readiness at the same time.
Managers should compare FTFR across similar job types. A technician may perform well in one area but need training in another.
Low FTFR does not always point to poor performance. Weak job briefing or missing parts can also reduce success rates.
Still, consistent FTFR below 70% usually signals a deeper issue that needs review.
This metric tracks technician productivity over a set period. It measures how many jobs each technician completes.
Raw job count alone can mislead managers. Eight simple jobs do not equal three highly complex repairs.
The better method compares completed jobs against expected duration estimates. That creates a fairer view of performance.
Technicians who often exceed expected time may face skill gaps, poor information flow, or process delays. Technicians who finish far too quickly may skip quality steps.
Managers should always balance speed with job quality.
This metric compares planned job time against actual completion time.
Technicians who finish close to the estimate usually work in a stable and predictable way. That improves scheduling and customer communication.
Long overruns may point to weak diagnostics, unclear instructions, or inefficient workflows. Fast completion times may look positive at first but can hide rushed work.
Managers should compare this metric against first-time fix rate. A technician who works fast but creates repeat visits often skips key steps.
Accurate job estimates also matter. Poor estimates create misleading performance data.
Customer feedback adds the customer perspective to technician performance management.
Most FSM systems can send surveys after work order completion. That makes customer feedback part of the normal workflow.
Managers should focus on trends instead of isolated reviews. One bad review may reflect a difficult customer rather than poor technician behaviour.
Job volume also matters. A technician with 200 completed jobs and strong scores provides more reliable data than one with only five jobs.
Low scores from specific accounts may reveal communication issues rather than technical problems.
Repeat visit rate tracks how many completed jobs need another visit for the same issue within 30 days.
Many field service teams ignore this metric. That creates a blind spot in performance management.
High repeat visit rates often predict customer frustration and churn. They also reveal hidden quality problems.
Managers should segment repeat visits by asset type and job category. That helps uncover root causes faster.
Some technicians may struggle with one equipment type while performing strongly elsewhere.
Technicians should log every used part against the work order.
That matters for both inventory control and revenue protection. Missing parts logs create stock errors and lost billing opportunities.
Digital work orders help managers compare planned parts against actual parts usage.
Frequent mismatches may reveal process issues or poor habits. In serious cases, they may require deeper investigation.
Parts accuracy also improves future planning and stock forecasting.
Performance data should support technician growth, not fear.
Managers should share metrics openly with technicians. People improve faster when they understand their own performance trends.
Transparency also builds trust. Technicians often spot issues themselves once they see the data clearly.
Managers should segment metrics before making conclusions. Different job types require different skills and timelines.
One poor job rarely means much. Consistent patterns matter far more than isolated incidents.
Coaching should remain the main goal. Performance data works best when it guides training, support, and skill development.
Disciplinary action should only happen when strong evidence shows repeated underperformance.
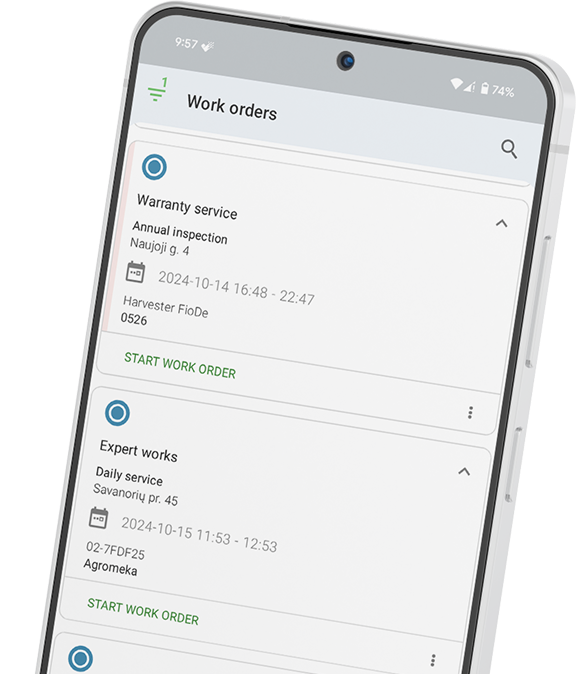
Frontu captures technician performance data automatically during normal work order execution.
Technicians complete jobs through the platform as part of their daily workflow. The system then builds performance data in the background without extra admin work.
Managers can view individual technician dashboards with first-time fix rate, average job duration versus estimate, completed jobs, and customer satisfaction scores.
Team comparison views help managers benchmark performance across the workforce. Trend reporting also makes long-term patterns easier to identify.
Because the data comes directly from completed work orders, the reporting stays objective and consistent.
Teams can also connect this performance data with wider field service management workflows and operational reporting.
Managers who want deeper visibility can also explore additional Frontu features built for field service operations.
See your team’s performance data in Frontu and book a free demo.
The best method uses work order data from a digital FSM platform. Key metrics include first-time fix rate, repeat visit rate, customer satisfaction, job duration, and completed jobs.
Most strong field service teams target 75% to 80% or higher. Consistent results below 70% usually signal a process or skills issue.
Always compare technicians within similar job types and asset categories. Raw job counts alone create unfair comparisons.
Yes. Technicians improve faster when they can review their own metrics and discuss trends with managers.
Repeat visit rate measures how often completed jobs need another visit for the same issue. High repeat rates often predict customer dissatisfaction and quality problems.


Our list of integrations is updated frequently. Explore each integration in its own separate page for more information.
Link copied!
Join 10,000+ FSM leaders. Subscribe to our monthly expert-led newsletter. We find and report on case studies, success stories and playbooks that are working out there right now.